VTEX Sales App: Sales Performance
Sales Performance is a page within VTEX Sales App that allows merchants and sales associates to view the store sales metrics and compare performance across sales dates and staff members.
You can access your store sales performance metrics by following the steps below:
- In Sales App, go to the main page.
- Click the menu icon .
- Click Sales Performance.
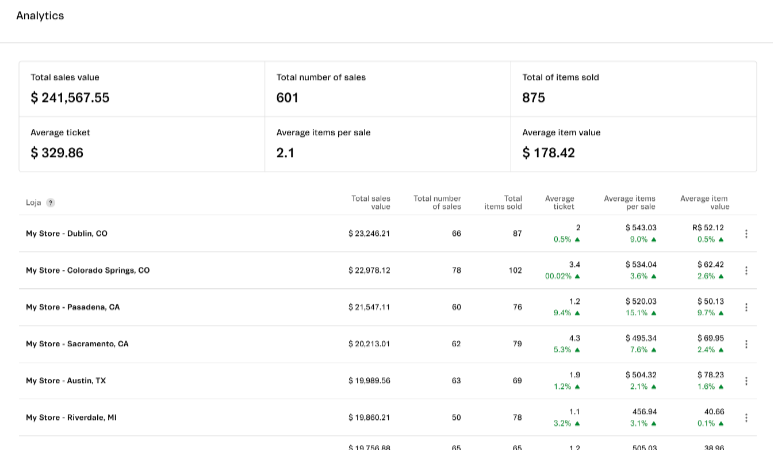
On this page, you will have access to the following metrics:
- Total sales amount: Displays the total sales amount of the store for the selected dates in the Display field (blue) and the Compared to field (gray), indicating the percentage increase or decrease in sales in this comparison.
- Total number of sales: Displays the total number of store sales for the selected dates in the Display field (blue) and the Compared to field (gray), indicating the percentage increase or decrease in sales in this comparison.
- Total of items sold: Displays the total number of items sold by the store for the selected dates in the Display field (blue) and the Compared to field (gray), indicating the percentage increase or decrease in sales in this comparison.
- Average ticket: Displays the store average ticket for the selected dates in the Display field (blue) and the Compared to field (gray), indicating the percentage increase or decrease in sales in this comparison.
- Average items per sale: Displays the average number of items per sale for the dates selected in the Display field (blue) and the Compared to field (gray), indicating the percentage increase or decrease in sales in this comparison.
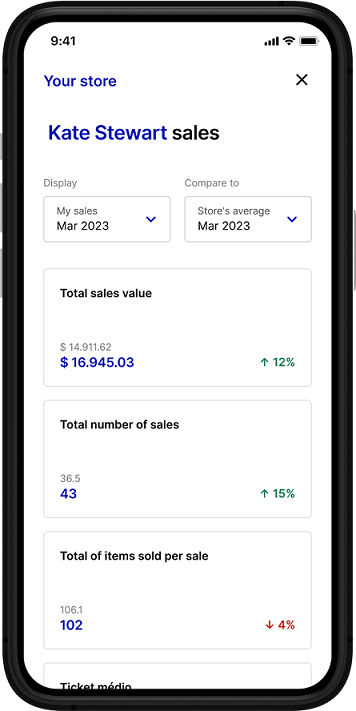
Staff metrics
To view specific metrics for a sales associate, follow the steps below:
- Click the icon.
- Select the sales associate profile and enter the password.
- Click
Confirm.
On this page, you will have access to the following metrics for that sales associate:
- Total sales amount: Displays the total sales amount of that sales associate for the selected dates in the Display field (blue) and the Compared to field (gray), indicating the percentage increase or decrease in sales in this comparison.
- Total number of sales: Displays the total number of sales made by the sales associate for the selected dates in the Display field (blue) and the Compared to field (gray), indicating the percentage increase or decrease in sales in this comparison.
- Total of items sold: Displays the total number of items sold by the sales associate for the selected dates in the Display field (blue) and the Compared to field (gray), indicating the percentage increase or decrease in sales in this comparison.
- Average ticket: Displays the sales associate average ticket for the selected dates in the Display field (blue) and the Compared to field (gray), indicating the percentage increase or decrease in sales in this comparison.
- Average items per sale: Displays the sales associate average number of items per sale for the selected dates in the Display field (blue) and the Compared to field (gray), indicating the percentage increase or decrease in sales in this comparison.