This guide answers the most frequently asked questions about how to use the VTEX Admin dashboards during Black Week.
- What's the best way to monitor my ecommerce website during Black Week in the VTEX Admin?
- How can I track my ecommerce data beyond today?
- Why are my metrics different from the Orders page in the Admin?
- Why don't I have session or conversion rate data?
- Why don't my conversion rate, new sessions, or sales funnel metrics match the numbers from my internal tools?
- Why is my revenue metric only showing in one currency when I operate with more than one?
- Why doesn’t the number of orders in the sales funnel analysis match the one in the Monitoring section?
- Why is the new Overview in a separate URL?
What's the best way to monitor my ecommerce website during Black Week in the VTEX Admin?
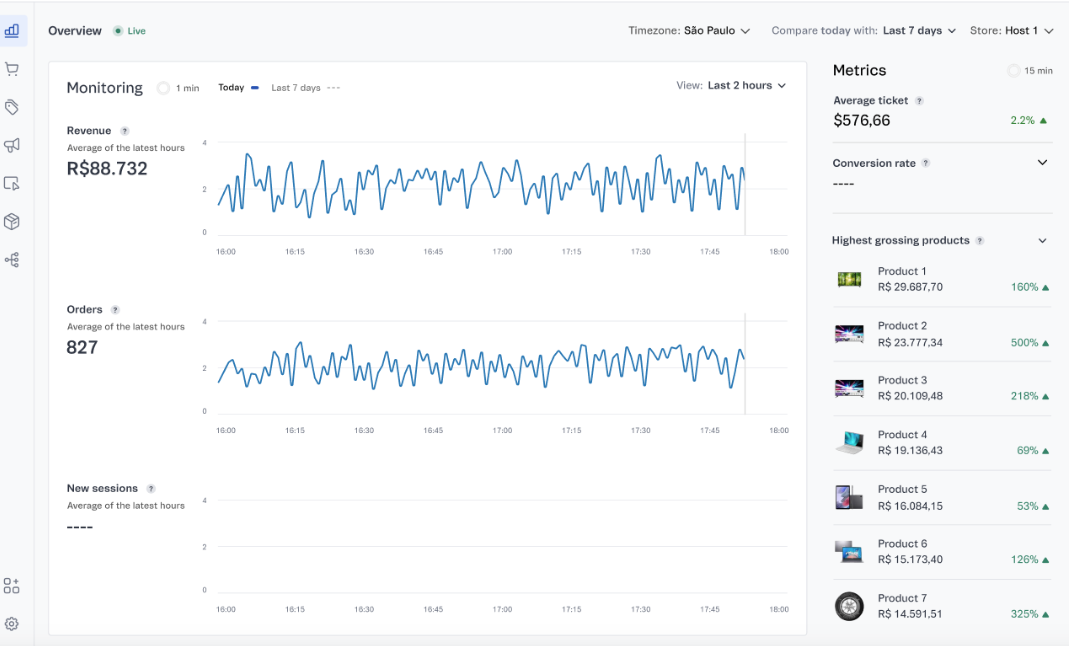
During Black Week, a period of intense sales activity and volatility, the ideal monitoring tool is the new VTEX real-time Overview. To access this page, go to Dashboards > Overview in the navigation menu or enter Overview in the bar at the top of the page.
Below are some tips to best leverage this feature:
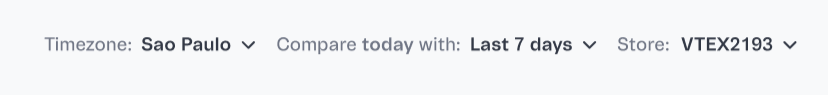
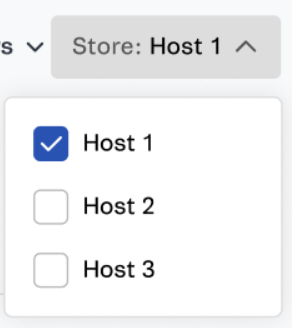
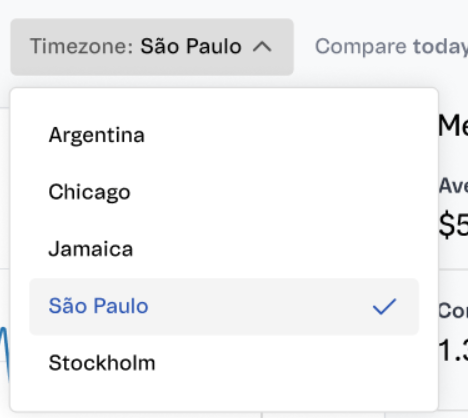
Start by setting the desired time zone and selecting the store you want to monitor in the real-time Overview.
Reference filter
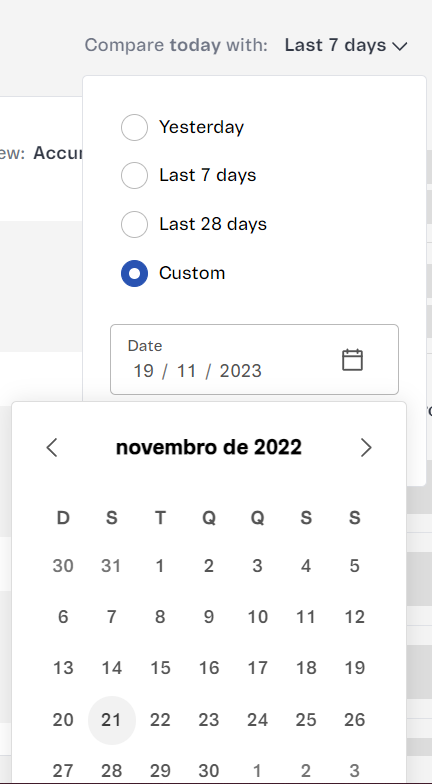
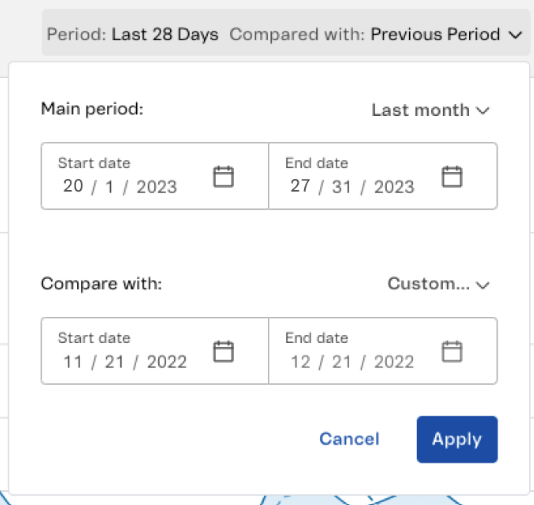
The reference filter or Compare today with compares your current performance against a specific period.
To configure the reference filter, follow these steps:
- Click
Compare today with. - Select
Custom. - Set a date.
- Click
Apply.
A useful comparison during Black Week is with the same date last year. In the reference filter, select a date between November 21, 2022 and November 27, 2022, ideally the same days of the week. This option is available for clients who were already using the VTEX platform during that period last year.
View filter
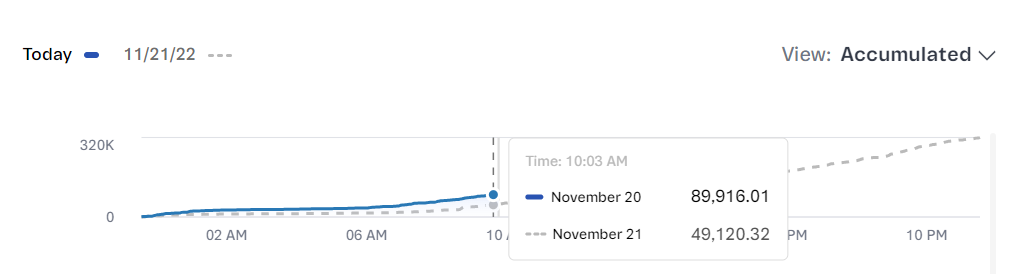
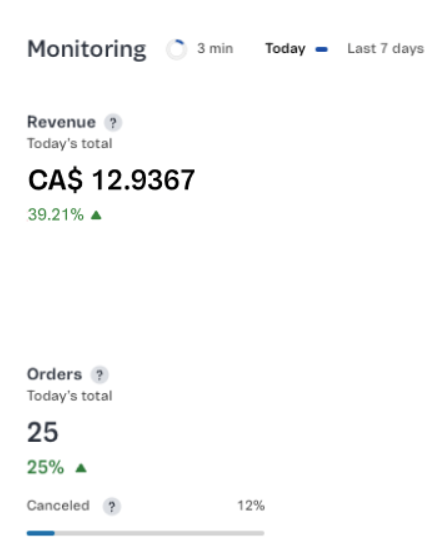
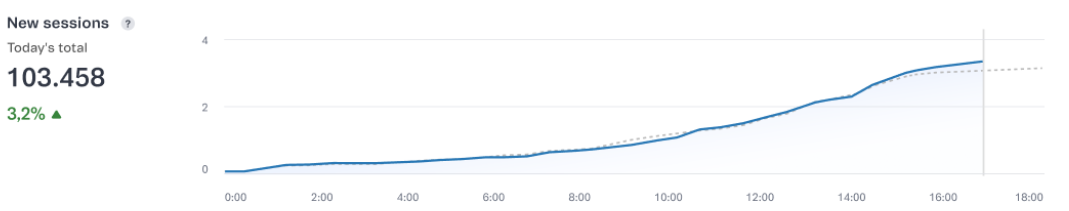
- Track the day’s performance with the cumulative view: Use the cumulative view to monitor the sales performance of your ecommerce website minute by minute. This will provide insights that will enable quick operation adjustments.
To select the cumulative view in the dashboard, click View > Accumulated.
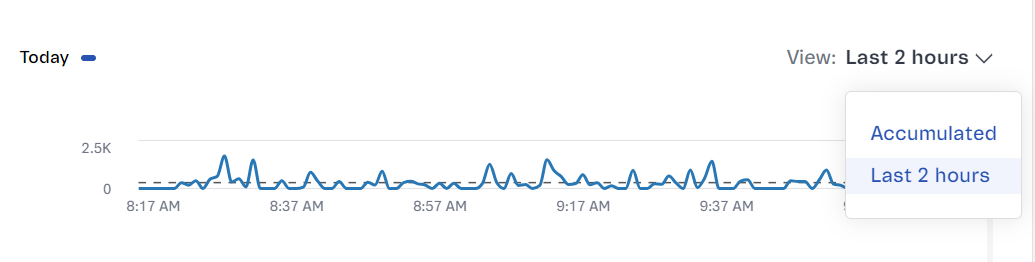
- Track performance in the last hours: The Last 2 hours view shows the metrics isolated minute by minute, which is important for guaranteeing the operational stability of your store during the event.
To select Last 2 hours in the dashboard, click View > Last 2 hours.
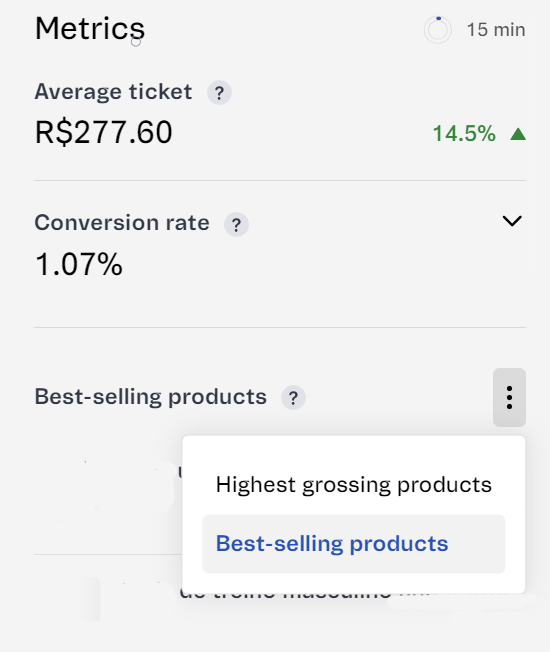
Metrics
The real-time Overview provides important insights into your sales strategy. For instance, you can use the best-selling products as a reference to boost campaigns and further leverage your results.
To view the best-selling products, in the Metrics section click the button and select Best-selling products.
For analyzing or monitoring longer periods, we recommend using our Sales Performance dashboard, which will be explained in the next question.
How can I track my ecommerce data beyond today?
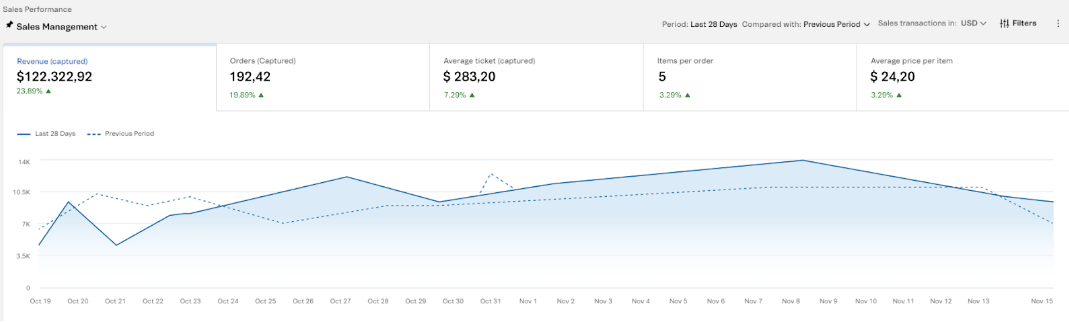
The VTEX Sales Performance dashboard is the right tool for normal monitoring of your ecommerce operation. It offers a longer history with a refresh rate of 90 minutes. The points below explain how to leverage this dashboard.
Filters
- Date
When you go to the dashboard, the first step is to set the date for Main period and Compared with. If you’re running an analysis after Black Week, select Last week to compare with last year's Black Week (available if you were a VTEX client at that time). During Black Week, select Custom date and set the specific days to analyze.
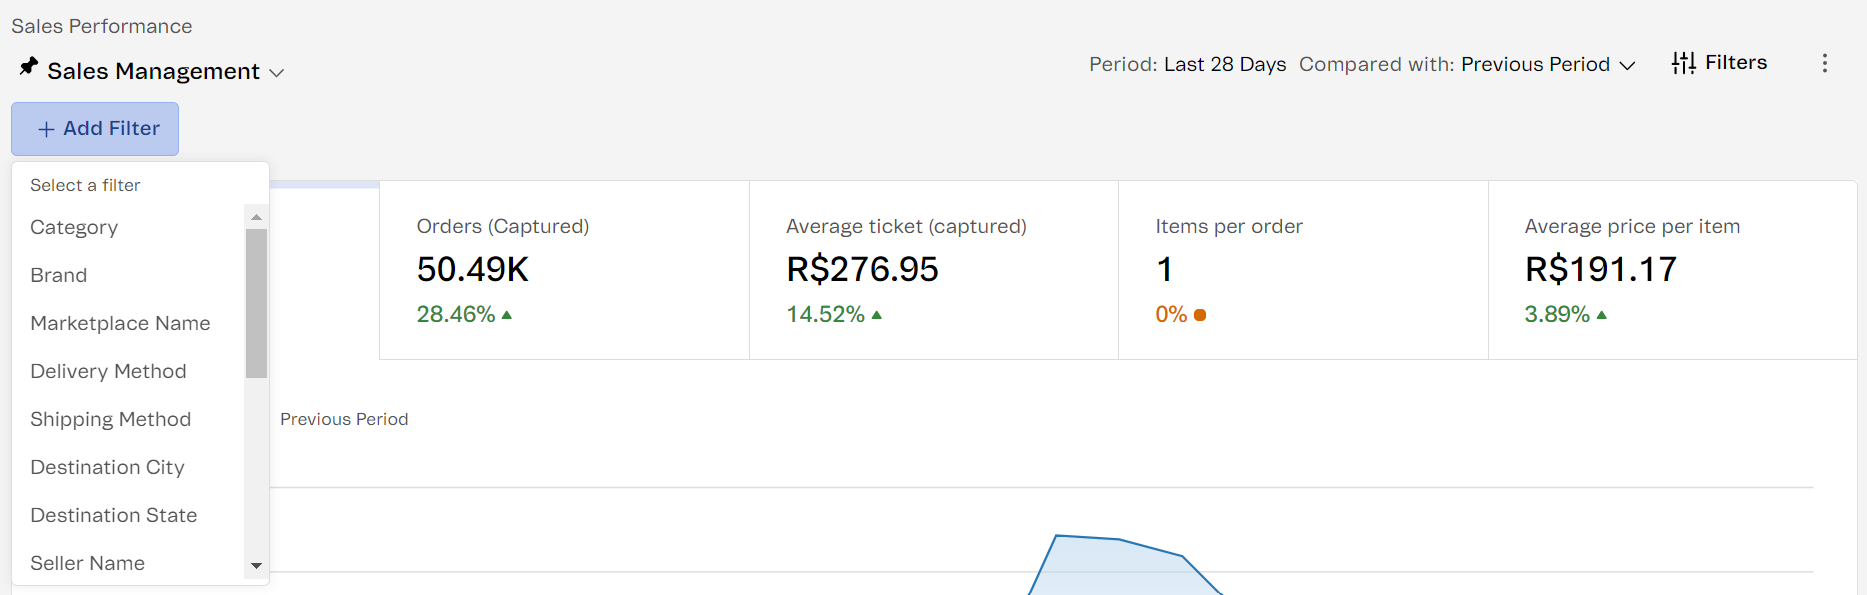
- Combined filters
The data displayed on the Sales Performance dashboard can be segmented using combined filters, such as category. To add a new filter, follow the steps below:
- In the Sales Performance dashboard, click Filters.
- Click Add Filter.
- Select the desired categories.
- Click
Apply.
You can explore other filters based on the needs and specific aspects of your ecommerce operation.
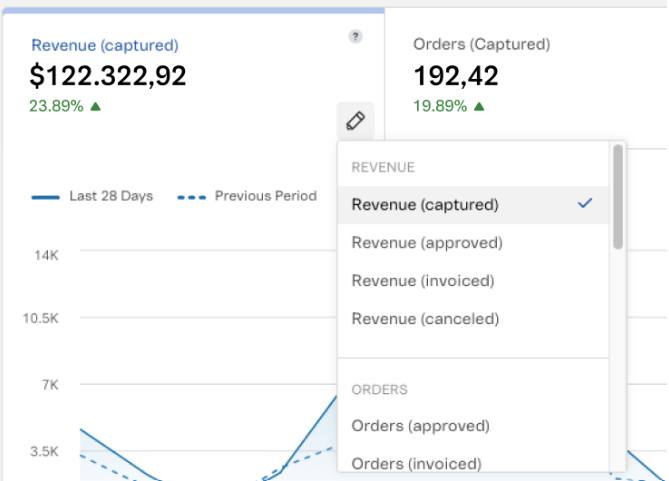
Metrics
You can customize the displayed metrics to analyze different things. Metrics can be edited by clicking the button next to the name.
During Black Week, this dashboard can be used to analyze the following performance metrics:
- Revenue (approved)
- Orders (approved)
- Orders (captured)
- Average ticket (approved)
- Orders (canceled)
- Week’s performance
After making adjustments, compare the current week's performance with last year's Black Week to identify trends and opportunities.
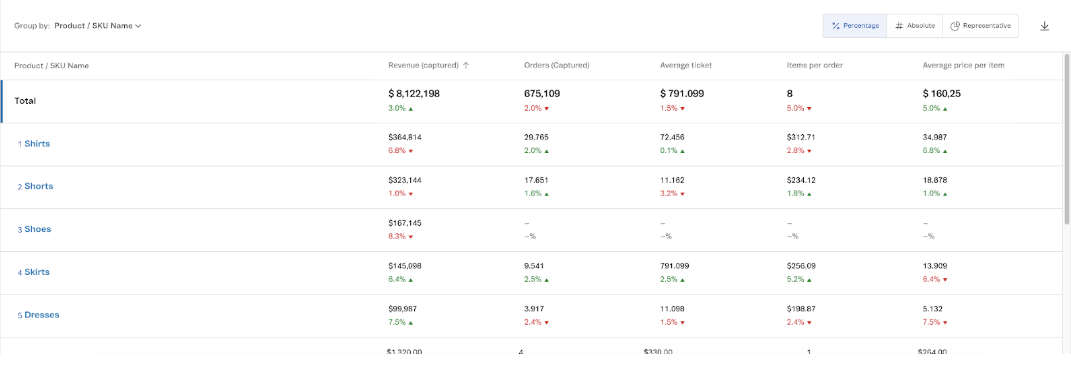
- Table analysis
Analyze the breakdown table for deeper insights. For example, SKU analysis can reveal which products should be highlighted in future campaigns.
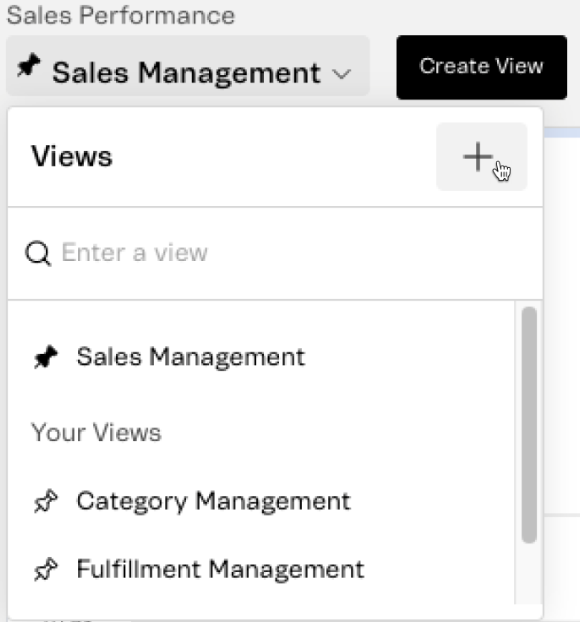
- Save your view
Save your dashboard configuration for future queries. Click Sales Management > > Add a name >Createto save your custom view.
Why are my metrics different from the Orders page in the Admin?
There are several reasons why metrics in the real-time Overview might differ from the Orders page in the Admin:
- Overview: The metrics displayed by the VTEX Admin dashboards only consider sales from one store at a time. Therefore, all the metrics refer to the store selected in the dashboard filter.
- Orders: The order metrics consider all sales completed during the selected period.
- Different refresh rates: The Overview page refreshes every 1 to 3 minutes. Therefore, a slight discrepancy (1 to 3% of the total) between the two pages is common.
- Revenue calculation formula: The metrics in Overview don’t consider discounts, shipping, surcharges, and promotions in the revenue calculation, while the Orders page does take these factors into account.
To see the data from all stores, use the Sales Performance page, which shows aggregated data with an approximate refresh rate of 90 minutes.
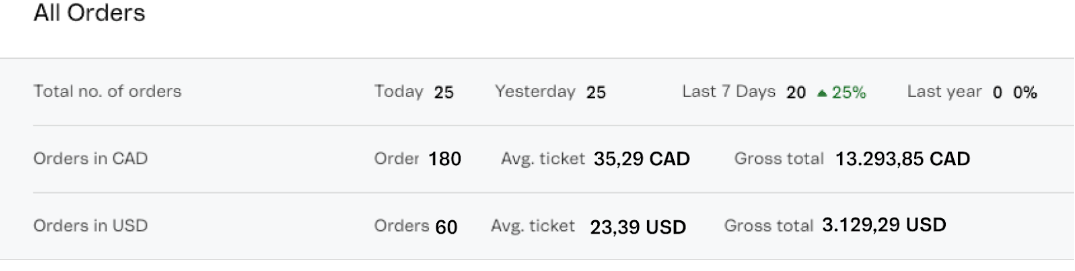
If your operation uses more than one currency, the Overview dashboard will sum your orders in the currency that is most used in your sales. To make a comparison with the Orders page, you need to sum the order total from all your currencies.

- Time zone: This filter is available in Overview. If you use a time zone that is different from the Orders page default (which is your current time zone), the metrics will not match. Adjust the time zone as needed.
Why don't I have session or conversion rate data?
The conversion rates, sessions, and sales funnel analyses in VTEX are based on data captured by our navigation base, which relies on a specific script executed within the online stores of the clients. This script is crucial for recording the necessary information for these analyses.
However, it’s important to note that our script does not capture data from sessions originating from marketplaces, apps, or headless implementations where we don't manage the frontend. Furthermore, custom modifications to the frontend of the store can interfere with or even deactivate our script. This means that, in some cases, these sessions and activities are not recorded, resulting in a lack of session or conversion rate data on your dashboard.
If you notice this data is missing, it may be due to these limitations. We recommend checking the script settings and any frontend customizations that might be affecting data capture.
Why don't my conversion rate, new sessions, or sales funnel metrics match the numbers from my internal tools?
Other analytics tools, such as Google Analytics, are usually installed with customizations and higher priority and are thus able to capture a broader spectrum of data. This often results in discrepancies when compared to our numbers.
On the other hand, VTEX captures navigation data using its own script, which is executed within the online stores of clients. Because this script is loaded last on the page to minimize the impact on performance, very brief sessions may not be recorded.
It’s important to note that our script does not capture data from sessions originating from marketplaces, apps, or headless implementations. Furthermore, customizations made by the client to the frontend can interfere with or even deactivate our script, impacting data collection.
Why is my revenue metric only showing in one currency when I operate with more than one?
VTEX displays the value in a single currency to simplify the renderization of the revenue graph in the monitoring section of the real-time Overview. This provides a clear and straightforward view of revenue without the added complexity of multiple currencies.
To determine which currency to display, we assess the most used currency in online store sales and convert all other amounts to that currency. This is done to offer a simpler and more direct understanding of sales performance.
As a result, if you operate with more than one currency, you need to sum the total orders from the Admin Orders page across all your currencies to match the order data shown in the real-time Overview.
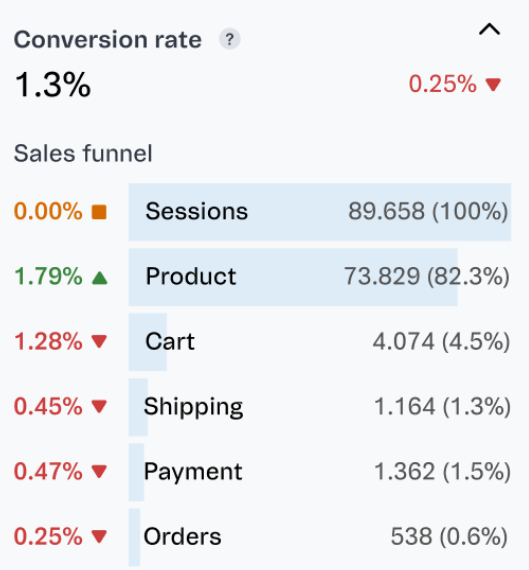
Why doesn’t the number of orders in the sales funnel analysis match the Monitoring section?
To understand this discrepancy, it’s important to remember that the monitoring metrics in the real-time Overview are generated from our Order Management System (OMS). The OMS contains information about all different types of store orders, including marketplace, direct, and app sales.
On the other hand, the data from the sales funnel is collected from the site's navigation base, which exclusively captures sales data from within the client’s online store. This means that sales completed on marketplaces or in other stores that do not use the VTEX storefront are not included in the funnel.
As a result, it is common for the number of orders in the sales funnel to be lower than the Monitoring section, which provides a broader view of store sales, including channels outside the VTEX platform.
Why is the new Overview in a separate URL?
VTEX chose to temporarily maintain the old Overview page while introducing the new real-time Overview. To ensure a smooth transition and uninterrupted access to the previous version, the new Overview is being hosted in a separate environment. This means that when accessing the new Overview, you may be prompted to log in to the VTEX Admin again.
It’s important to note that occasionally, you might encounter errors when trying to load the new Overview page. These errors are generally related to re-authentication in the system due to the separate environment where the new Overview is being hosted.
We are working towards integrating the new Overview back into the original VTEX Admin environment. Once this integration is complete, we plan to deprecate the old page to simplify the process and enhance the user experience. We appreciate your patience and understanding during this transition.